A lap time tells you which lap was faster. Telemetry shows where the gap changed and which visible traces changed with it. Are you ready to dive in?
Hash Racing places two laps on the same distance axis and keeps the track replay, lap delta, speed, throttle, brake application, engine speed, gear, and DRS synchronized. You can move from the result to the evidence without guessing where on the circuit to look.
This guide follows that exact workspace. It describes only what you can inspect in the charts and separates a visible difference from a possible explanation.
Open the F1 telemetry workspace and follow along
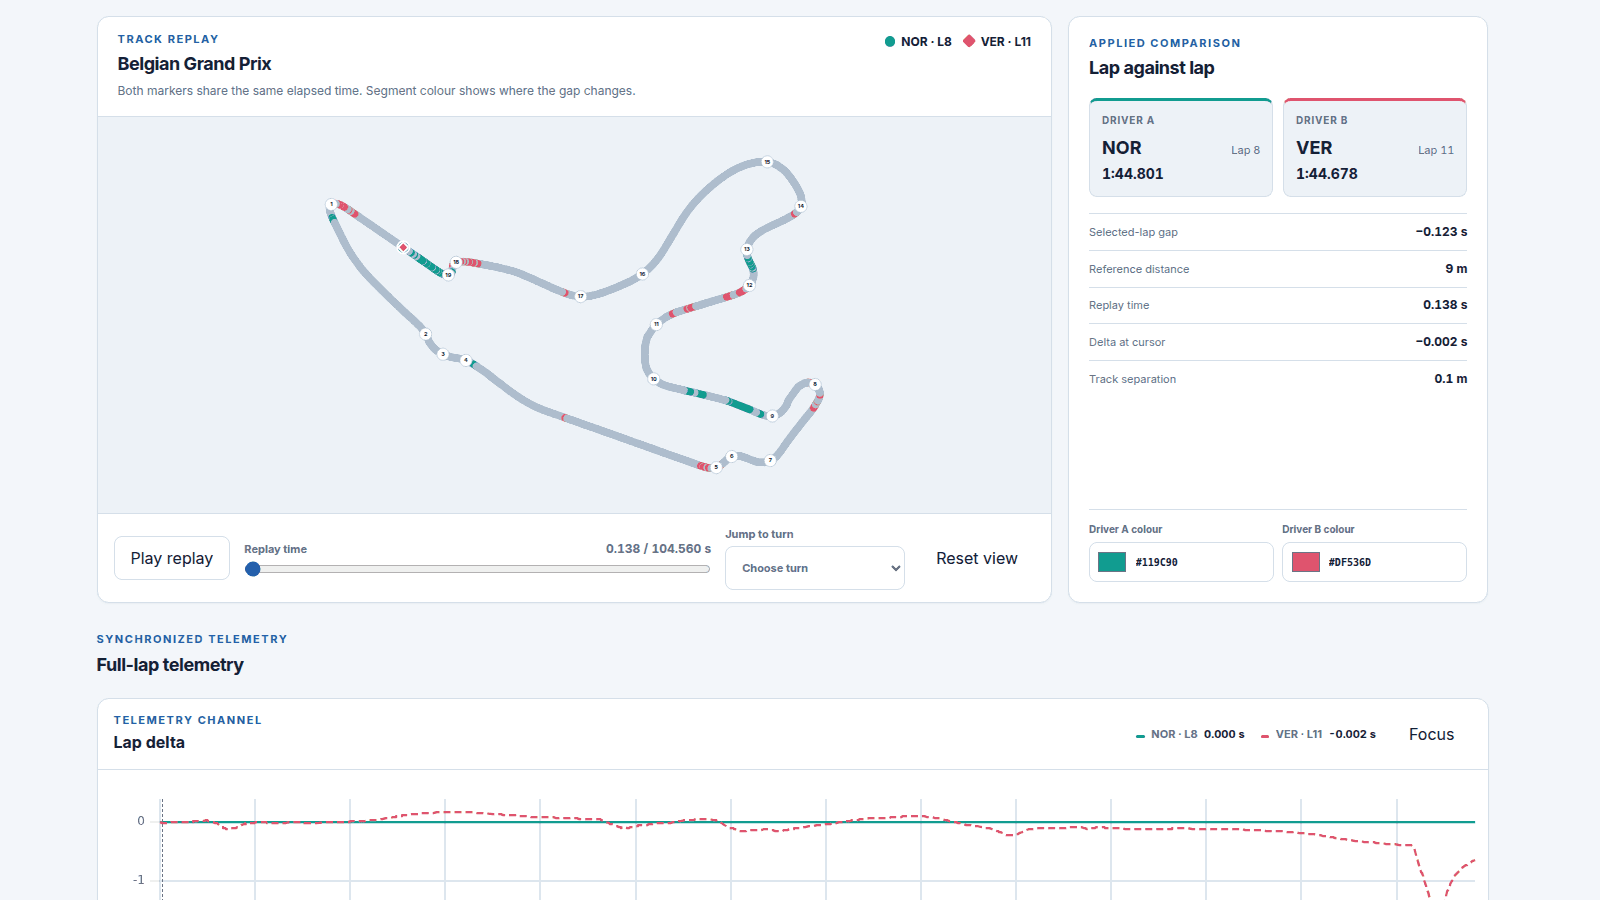
What F1 telemetry shows on Hash Racing
Every chart uses distance around the lap on the horizontal axis. That gives both drivers the same reference: the same x-position represents the same point on the circuit.
The seven panels answer different questions:
| Panel | What you can observe |
|---|---|
| Lap delta | Where the comparison lap gains or loses elapsed time |
| Speed | Braking zones, minimum speed, acceleration, and straight-line speed |
| Throttle | Full-throttle sections, lifts, partial application, and the return to power |
| Brake | Where braking is applied and released |
| Engine speed | How RPM changes with speed and gear selection |
| Gear | Shift points and the selected gear at each distance |
| DRS | Recorded DRS-state changes when they are present in the selected laps |
These channels are most useful together. A change in one trace is an observation, not a complete explanation by itself. Start with the time difference, find the same region in the other panels, and describe only what the lines support.
Start with lap delta and speed
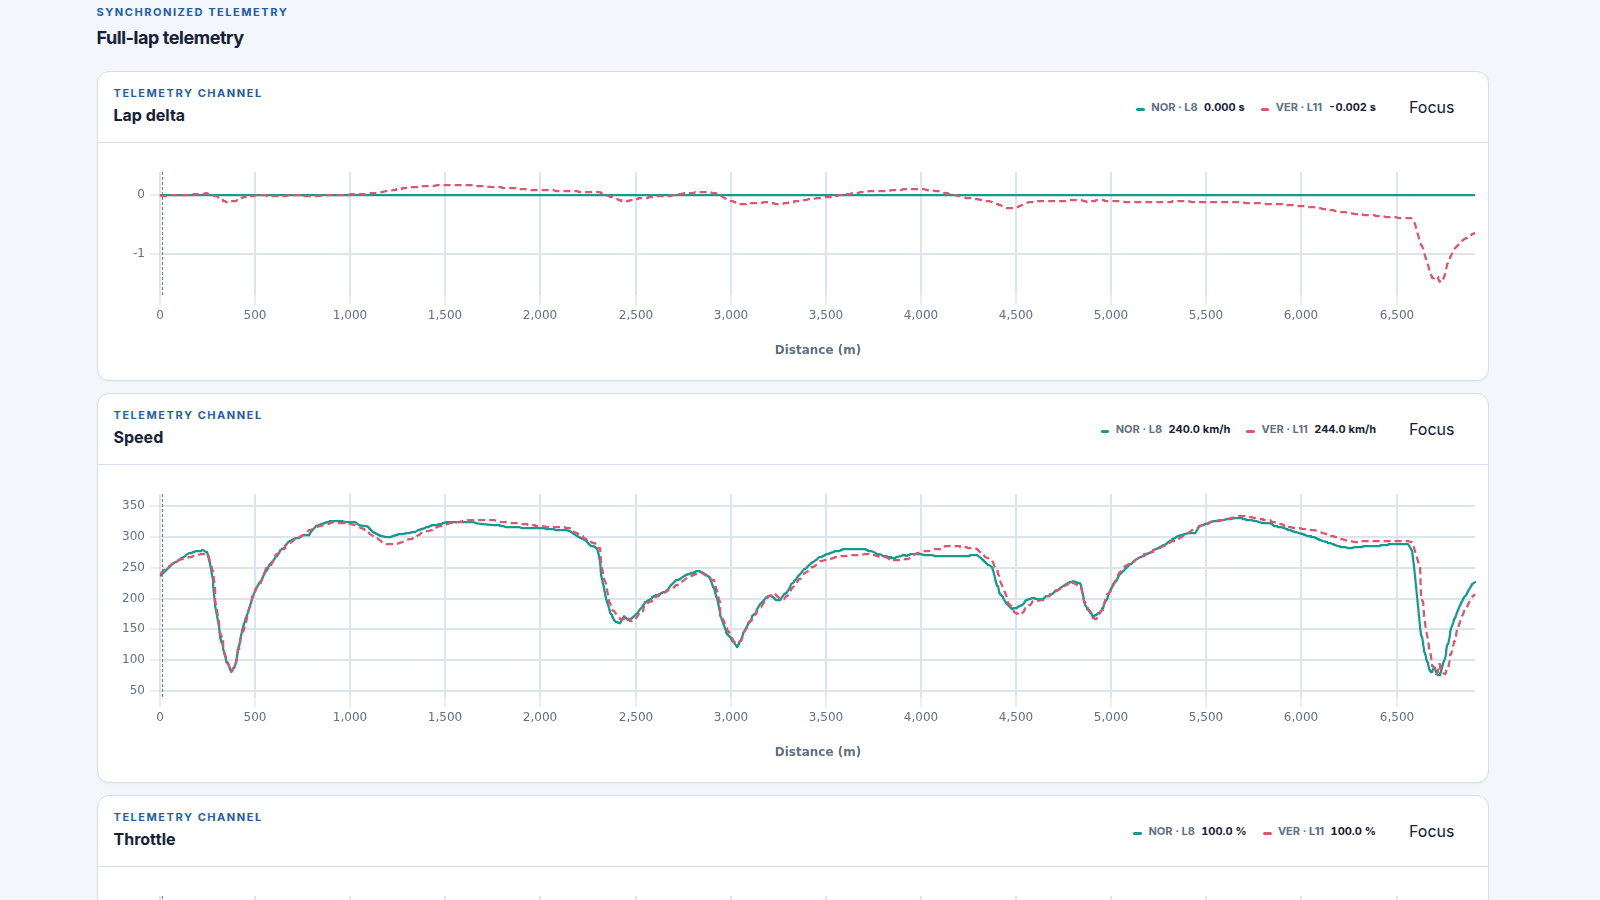
Lap delta and speed give you the quickest overview of a comparison.
Read the lap delta direction
Hash Racing treats Driver A as the reference, so that line remains at zero. The Driver B line shows Driver B's elapsed time minus Driver A's elapsed time at the same distance:
- Below zero: Driver B reached that distance sooner.
- Above zero: Driver B reached that distance later.
- Moving downward: Driver B is gaining time.
- Moving upward: Driver B is losing time.
- Nearly flat: the gap is stable through that section.
The shape matters more than one isolated value. Look for sustained movement rather than a tiny single-point change.
Use speed to locate the shape of a corner
A speed trace usually falls into a braking zone, reaches a minimum around the slowest part of a corner, and rises as the car accelerates away.
When two speed traces separate, ask:
- Which trace begins falling first?
- Which reaches the higher minimum speed?
- Which begins rising first?
- Does the difference remain down the following straight?
The delta tells you whether time was gained. The speed trace shows what the car's speed was doing in the same region.
Read throttle and brake application
Speed shows the outcome. Throttle and brake application add the visible driver inputs available in the workspace.
Throttle
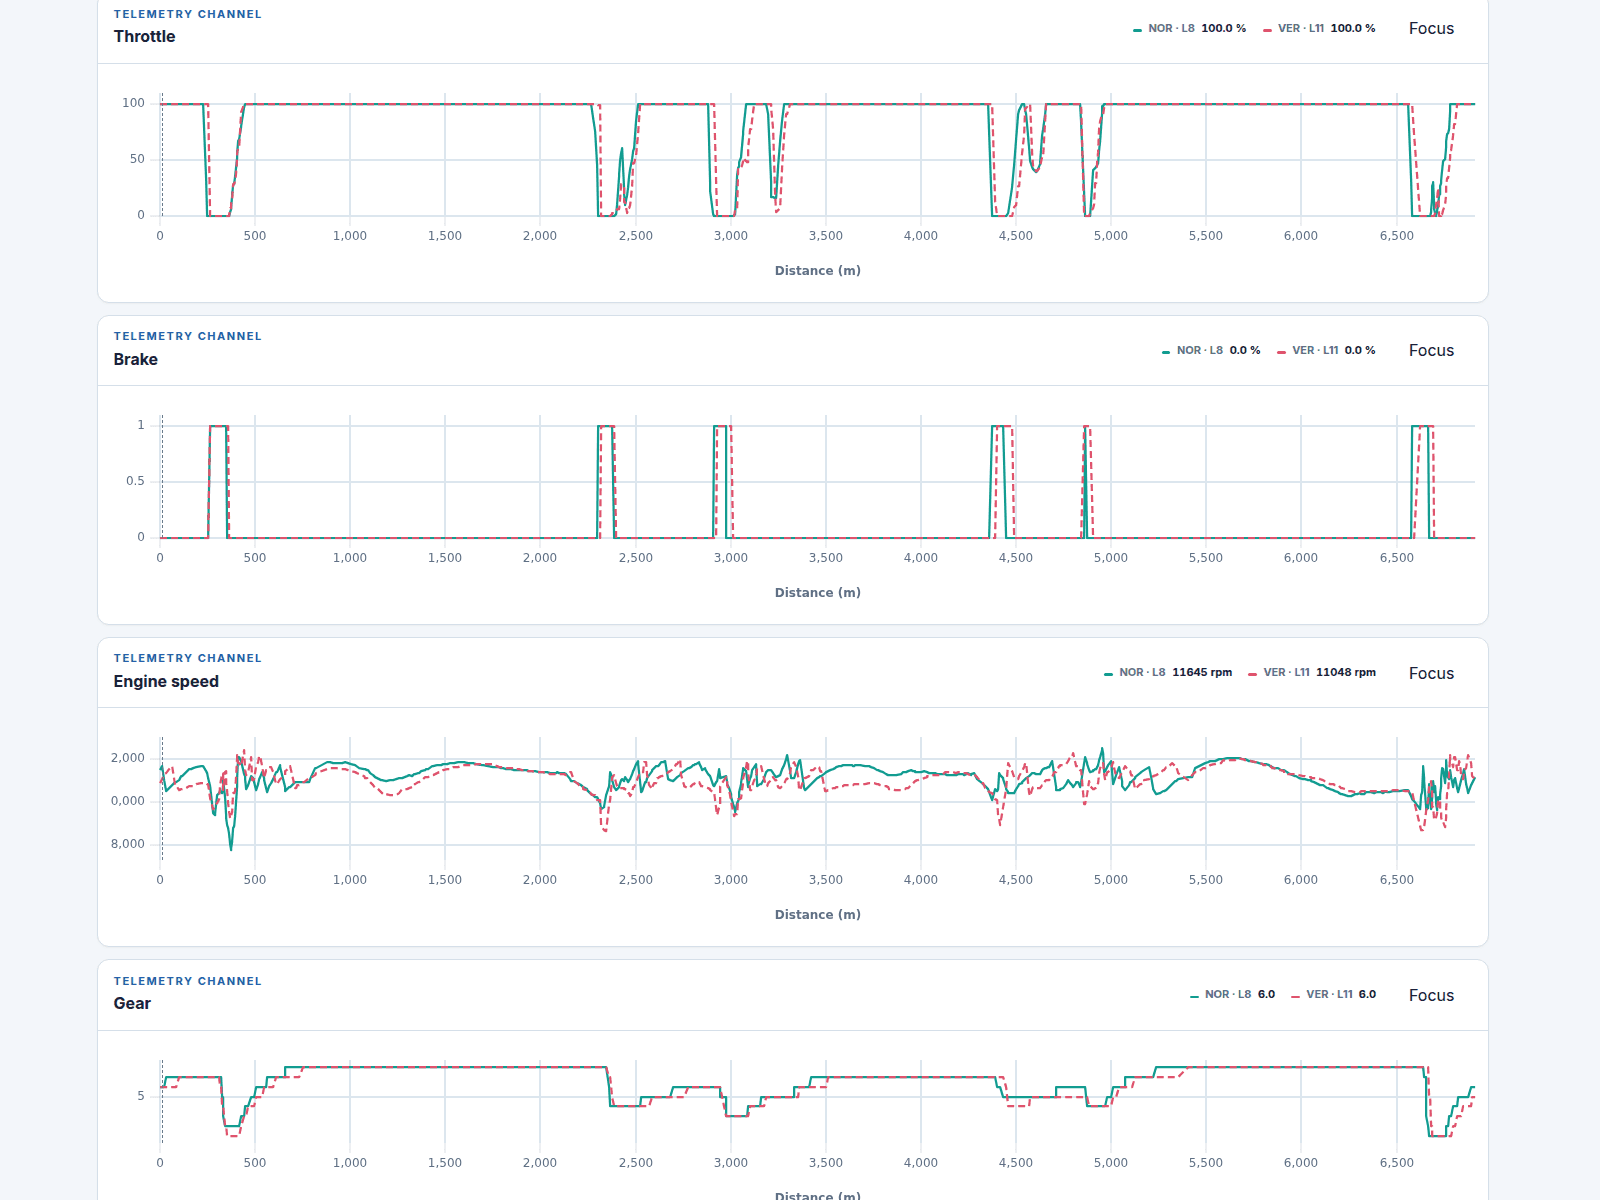
Throttle is shown from 0% to 100%. Look for:
- where a driver lifts from full throttle;
- whether the trace stays at zero or uses partial throttle;
- where throttle begins returning;
- where the trace reaches 100% again.
An earlier return to full throttle is easy to see, but it is not automatically better. Check the speed and delta afterward. If the delta does not improve, the earlier input did not create a visible time gain in that section.
Brake application
The brake channel is an on/off signal. It shows when braking is applied and when it is released.
Use it to compare:
- the distance where braking begins;
- the length of the recorded braking phase;
- the point where braking ends;
- whether throttle is also at zero before or after the braking phase.
If throttle is at zero while brake is off, the charts show a coasting phase. The traces do not establish why the driver coasted, so keep the conclusion at the level of the visible data.
Use engine speed and gear as supporting evidence
Engine speed and gear help explain changes that are already visible in the speed trace.
The gear panel is stepped rather than smooth. You can compare where each shift occurs, which gear is selected through a corner, and whether the drivers use the same sequence.
The engine-speed panel shows RPM over the same distance. Read it alongside gear: a sudden RPM change near a gear step is visible evidence of a shift. A difference in RPM without a gear change is still an observation, but the charts alone may not establish its cause.
These panels are supporting evidence. Begin with delta and speed, then use RPM and gear when they clarify the same part of the lap.
Interpret DRS only when the trace changes
DRS is recorded as a discrete state rather than a smooth measurement. Look for clear transitions and compare their distance along the lap.
If the DRS trace stays flat or contains no meaningful change, it adds nothing to that comparison. Skip it and continue with the channels that contain visible evidence. Do not build an explanation around an inactive panel.
Compare one corner step by step
Use the same sequence every time. A repeatable process makes it less likely that one dramatic-looking line will distract you from the actual time change.
1. Choose comparable laps
Start with complete laps from the same session. Similar lap types and tyre compounds make the visual comparison easier to interpret. Avoid laps marked as deleted, inaccurate, pit-in, or pit-out laps.
2. Find movement in lap delta
Scan the delta trace for a sustained rise or fall. That identifies the distance range worth investigating.
3. Check speed in the same range
Compare the falling edge, minimum speed, and acceleration away from the corner. Note exactly where the traces separate and reconnect.
4. Check throttle and brake application
Look for differences in lift point, brake onset, brake release, partial throttle, and the return to full throttle. Remember that the brake trace is binary.
5. Add RPM, gear, and DRS when useful
Use these panels only if they show a difference in the same region. A flat or identical trace does not need an explanation.
6. Confirm the result
Return to lap delta. If the line keeps moving in the expected direction, the time gain or loss continued. If it reverses, the apparent advantage was temporary.
A good summary stays close to the evidence:
The comparison lap reaches this distance sooner. In the same region, its speed trace begins rising earlier and its throttle returns sooner.
That is more defensible than assigning the difference to driver confidence, car setup, grip, or another cause the charts do not directly show.
Common telemetry-reading mistakes
Treating later braking as automatically faster
A later brake-on point can be visible while the delta still moves in the wrong direction. Judge the whole corner, especially minimum speed and the acceleration that follows.
Reading brake application as a continuous trace
The brake panel has two states. Use it to compare onset and release points.
Looking at a channel without checking delta
A larger speed value or earlier throttle input looks important, but lap delta shows whether it changed elapsed time.
Comparing unsuitable laps
Pit laps, deleted laps, incomplete laps, and obvious cooldown laps can create large differences that do not represent a useful performance comparison.
Explaining more than the data shows
Telemetry can show that two traces differ. It does not automatically prove the mechanical or human reason behind the difference.
Frequently asked questions
Which telemetry panels should I read first?
Start with lap delta and speed. Once you find a meaningful section, use throttle and brake application, followed by RPM and gear. Check DRS only when its state changes.
Is later braking always faster?
No. The brake-on point is only one part of the corner. Use speed and lap delta to check whether the later application produced a lasting advantage.
What does the brake chart show?
It shows where braking is applied and where it is released. Read it as a binary state and compare those transitions with speed, throttle, and lap delta.
Should telemetry be aligned by time or distance?
Distance is the clearest basis for stacked lap charts because every panel refers to the same place on the circuit. Hash Racing separately replays both cars at the same elapsed time on the track map.
Why does a telemetry panel sometimes look flat?
The selected laps may contain no state change in that channel. A flat panel is a reason to focus elsewhere, not to invent a difference.
Start a comparison
Choose a session, select two complete laps, and press Compare laps. Begin with the largest sustained movement in lap delta, then work downward through the same distance range.
Compare two F1 laps in Hash Racing